Visualizing the Impact of Partisan Gerrymandering
How state lines and district boundaries shape the US House of Representatives.
The United States House of Representatives was designed to closely mirror the political will of the people. However, due to how district boundaries are drawn within each state—a process known as gerrymandering—the actual partisan makeup of the House frequently diverges from statewide popular vote totals.
To understand the magnitude of this effect, I analyzed the 2024 House Election results, comparing each state’s total Democratic and Republican votes to the actual number of representatives elected for each party. By calculating the expected number of representatives based on the popular vote percentage and subtracting the actual number of representatives won, we can visualize the “swing” or advantage created by district lines.
The map below visualizes this net partisan swing across the country. States colored in red indicate a map that provided a disproportionate seat advantage to Republicans relative to their popular vote share, while states colored in blue indicate a map that disproportionately favored Democrats.
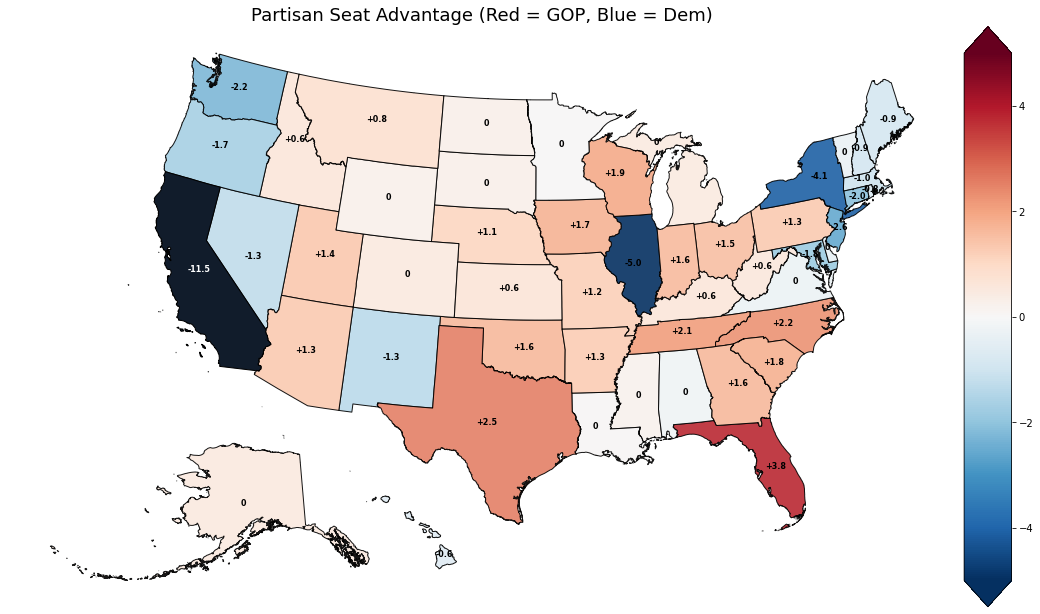
Gerrymandering occurs on both sides of the aisle. While individual states can skew wildly—California, for instance, is a massive outlier that heavily favors Democrats—what happens when we zoom out to the national level?
To answer this, I plotted the Expected House Makeup (if seats were perfectly proportional to the raw national popular vote) alongside the Actual House Makeup following the 2024 Election. As the charts below demonstrate, the aggregate effect creates a complex national landscape where the raw popular vote rarely translates perfectly into legislative power.
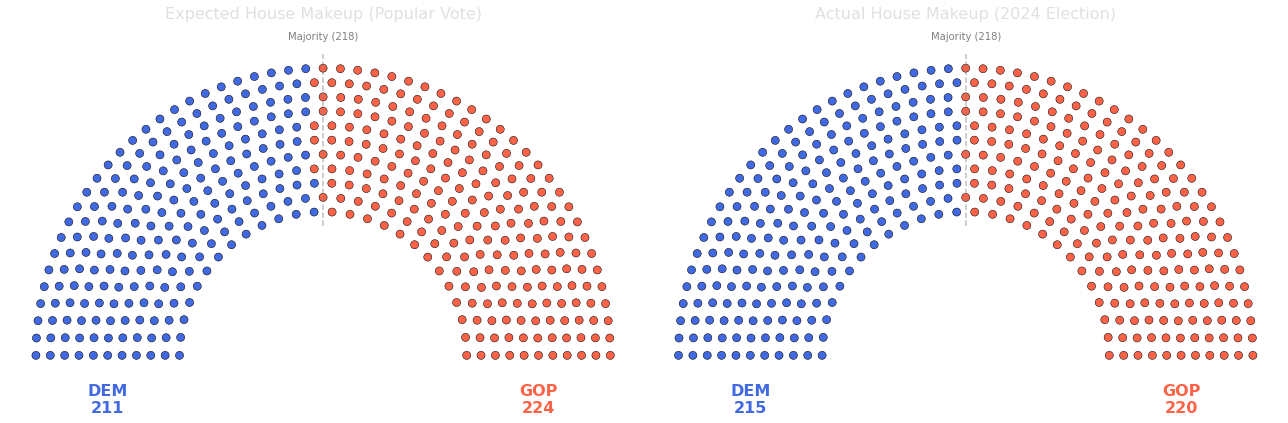
Ultimately, while partisan gerrymandering is highly effective at securing power at the state level, the competing district maps across the country largely canceled each other out in the 2024 election. Despite widespread geographic advantages for Republicans across a larger number of individual states, massive Democratic advantages in populous outlier states like California actually resulted in a net gain of 4 seats for Democrats nationally compared to what a strict popular vote would dictate. However, this 4-seat shift was not enough to flip control of the chamber, leaving Republicans with a narrow, yet secure, House majority.
It is important to note that these calculated “swings” are not exclusively the result of intentional gerrymandering. Natural geographic sorting—where Democratic voters tend to cluster heavily in urban centers while Republican voters are more efficiently distributed across rural areas—can naturally result in disproportionate seat counts without any deliberate manipulation of district lines. Other factors, such as uncontested races, incumbency advantages, and candidate quality, also play a significant role in creating gaps between the raw popular vote and ultimate legislative representation.
Data sourced from 2024 Election totals and visualized using Pandas, Geopandas, and Matplotlib.